Research
Is crypto dead?

It's not. Let's explore the state of crypto through the lens of fundamentals.
In this article, we provide a snapshot of the crypto market with the following metrics:
- Fees
- Revenue
- Token incentives
- Earnings
- Price to fees (P/F) and price to sales (P/S) ratios
- Daily active users
- Active developers
1. Fees
This metric tells us how much end users are willing to pay for the service that a protocol provides.
Examples:
Blockchains = transaction fees
Ethereum dashboard: https://tokenterminal.com/terminal/projects/ethereum
DEXs = trading fees
Uniswap dashboard: https://tokenterminal.com/terminal/projects/uniswap
Lending protocols = interest
Aave dashboard: https://tokenterminal.com/terminal/projects/aave
NFT marketplaces = royalties and marketplace fees
OpenSea dashboard: https://tokenterminal.com/terminal/projects/opensea
Cumulative fees to date
To date, the crypto market has generated ~$33B in aggregate fees.
Fees dashboard: https://tokenterminal.com/terminal/metrics/fees
2. Revenue
This metric tells us how much the protocol captures of the fees paid by end users, which means that it’s always some % of the fees.
Ethereum dashboard: https://tokenterminal.com/terminal/projects/ethereum
Uniswap dashboard: https://tokenterminal.com/terminal/projects/uniswap
OpenSea dashboard: https://tokenterminal.com/terminal/projects/opensea
Aave dashboard: https://tokenterminal.com/terminal/projects/aave
Cumulative revenue to date
To date, the crypto market has generated ~$15B in aggregate revenue.
Revenue dashboard: https://tokenterminal.com/terminal/metrics/revenue
3. Token incentives
This metric tells how much the protocol spends on user acquisition by issuing & distributing its governance tokens to users.
It's worthwhile to analyze this metric as a % of revenue, to get a sense of the economic sustainability of a protocol.
Ethereum dashboard: https://tokenterminal.com/terminal/projects/ethereum
Uniswap dashboard: https://tokenterminal.com/terminal/projects/uniswap
OpenSea dashboard: https://tokenterminal.com/terminal/projects/opensea
Aave dashboard: https://tokenterminal.com/terminal/projects/aave
Cumulative token incentives to date
To date, the crypto market has spent ~$100B+ in aggregate on token incentives.
Earnings leaderboard: https://tokenterminal.com/leaderboards/earnings
4. Earnings
This metric tells us how much the protocol has left of the revenue after subtracting the token incentives.
This metric should still be subtracted by the operational expenses of the DAO to arrive at a true net income figure.
Ethereum dashboard: https://tokenterminal.com/terminal/projects/ethereum
Uniswap dashboard: https://tokenterminal.com/terminal/projects/uniswap
OpenSea dashboard: https://tokenterminal.com/terminal/projects/opensea
Aave dashboard: https://tokenterminal.com/terminal/projects/aave
Cumulative earnings to date
To date, the crypto market has generated ~$1B+ in aggregate earnings.
Earnings leaderboard: https://tokenterminal.com/leaderboards/earnings
5. The price to fees (P/F) and price to sales (P/S) ratios
Price to fees (P/F) ratio
This metric tells us the relationship between a protocol’s market capitalization and the fees it generates per year.
All things equal, a lower ratio is usually better from an investor’s point of view.
Price to sales (P/S) ratio
This metric tells us the relationship between a protocol’s market capitalization and the revenue it generates per year.
All things equal, a lower ratio is usually better from an investor’s point of view.
Ethereum dashboard: https://tokenterminal.com/terminal/projects/ethereum
Uniswap dashboard: https://tokenterminal.com/terminal/projects/uniswap
Lido dashboard: https://tokenterminal.com/terminal/projects/lido-finance
Aave dashboard: https://tokenterminal.com/terminal/projects/aave
Snapshot of the latest P/F ratios
Currently, there are 15 protocols with a P/F ratio below 10.00x.
P/F dashboard: https://tokenterminal.com/terminal/metrics/pf
Snapshot of the latest P/S ratios
Currently, there are 4 protocols with a P/S ratio below 10.00x.
P/S dashboard: https://tokenterminal.com/terminal/metrics/ps
6. Daily active users
This metric tells us how many unique addresses call a protocol’s revenue-generating smart contract functions.
DAUs should be viewed together w/ the fees metric to understand how much each DAU is paying (easier to have more users if the service is cheap).
Ethereum dashboard: https://tokenterminal.com/terminal/projects/ethereum
Uniswap dashboard: https://tokenterminal.com/terminal/projects/uniswap
OpenSea dashboard: https://tokenterminal.com/terminal/projects/opensea
Aave dashboard: https://tokenterminal.com/terminal/projects/aave
Current aggregate DAU figure
Currently, there are ~2.5M daily active users among the most widely used protocols.
Active Users dashboard: https://tokenterminal.com/terminal/metrics/active-users
7. Active developers
This metric tells us how many developers are working on building the core protocol.
It’s a good proxy for “developer leverage” when viewed alongside other fundamentals. E.g. fees, revenue, or earnings per developer.
Ethereum dashboard: https://tokenterminal.com/terminal/projects/ethereum
Uniswap dashboard: https://tokenterminal.com/terminal/projects/uniswap
OpenSea dashboard: https://tokenterminal.com/terminal/projects/opensea
Aave dashboard: https://tokenterminal.com/terminal/projects/aave
Current aggregate active developer figure
Currently, there are ~1.7k active (core) developers working on the most widely used protocols.
Active Developers dashboard: https://tokenterminal.com/terminal/metrics/active-developers
Thank you for reading! All of the data presented in this article can be found for free on Token Terminal.
The authors of this content, or members, affiliates, or stakeholders of Token Terminal may be participating or are invested in protocols or tokens mentioned herein. The foregoing statement acts as a disclosure of potential conflicts of interest and is not a recommendation to purchase or invest in any token or participate in any protocol. Token Terminal does not recommend any particular course of action in relation to any token or protocol. The content herein is meant purely for educational and informational purposes only, and should not be relied upon as financial, investment, legal, tax or any other professional or other advice. None of the content and information herein is presented to induce or to attempt to induce any reader or other person to buy, sell or hold any token or participate in any protocol or enter into, or offer to enter into, any agreement for or with a view to buying or selling any token or participating in any protocol. Statements made herein (including statements of opinion, if any) are wholly generic and not tailored to take into account the personal needs and unique circumstances of any reader or any other person. Readers are strongly urged to exercise caution and have regard to their own personal needs and circumstances before making any decision to buy or sell any token or participate in any protocol. Observations and views expressed herein may be changed by Token Terminal at any time without notice. Token Terminal accepts no liability whatsoever for any losses or liabilities arising from the use of or reliance on any of this content.
Stay in the loop
Join our mailing list to get the latest insights!
Continue reading
- Sonic is live on Token Terminal

Sonic is live on Token Terminal
Token Terminal has completed its integration of Sonic to enable institutional-grade onchain analytics for the Sonic ecosystem. This integration improves the accessibility of Sonic's onchain data to enable more informed decision-making for all stakeholders in the ecosystem.
- New updates to the Token Terminal API

New updates to the Token Terminal API
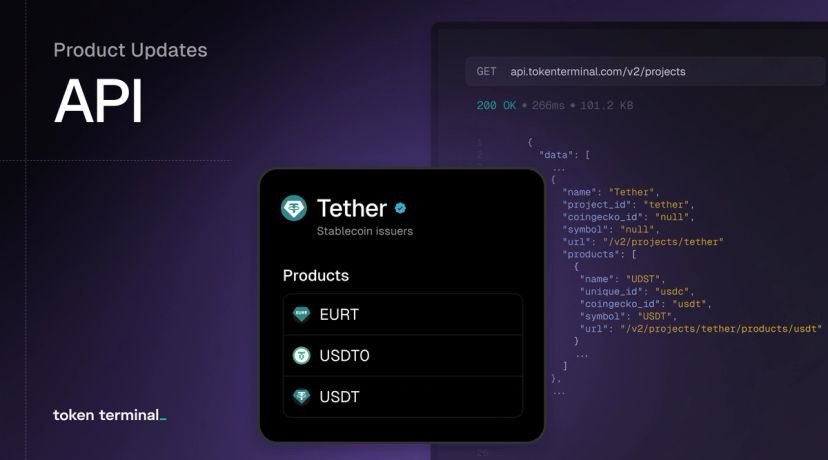
Over the past few weeks, we’ve shipped a series of customer‑driven upgrades to the Token Terminal API. In this post, you’ll get a quick tour of the changes—along with concrete, real‑world examples that show how teams are already putting our API to work.
- Changelog #012

Changelog #012
We’re launching our new market sector pages to bring you a deeper level of data access in our public data platform. You can easily explore projects within a market sector, see trends for any metric across any market sector, and even see what activity is happening by chain within a market sector.